


Data centres behind schedule: what every week costs, and how as-built data protects the programme
Hardly any building type is currently built as fast and as expensively as the data centre. Global demand for data centre capacity could nearly triple by 2030 to around 219 gigawatts, with roughly 70 per cent of the growth attributable to AI workloads; McKinsey puts the associated investment requirement at 6.7 trillion US dollars [1][2]. The build-out is under way in Germany too: around 12 billion euros are flowing into German data centres in 2025, connected load grew by 9 per cent to 2,980 megawatts and is expected to pass the 5,000 megawatt mark by 2030 [3].
It is precisely this momentum that makes delay more expensive here than almost anywhere else in construction.
Why delay hurts differently at a data centre
Three demonstrable peculiarities of the market sharpen every week lost:
- The capacity is sold before it stands. In the core North American markets around 74 per cent of the capacity under construction is already pre-let, where 40 to 50 per cent used to be normal; vacancy stands at an all-time low of 1.6 per cent [4]. A late data centre therefore delays revenue that is contractually agreed, not hypothetical.
- The capital tied up is enormous. For classic cloud data centres, build costs in established markets run at 10 to 12 million US dollars per megawatt, and at AI-capable densities with liquid cooling at 20 million and more [5]. Build costs are also still rising, most recently by 5.5 per cent a year [6]. A worked example with its assumptions on the table: a 50-megawatt project at 11 million US dollars per megawatt ties up around 550 million US dollars. At an assumed 6 per cent cost of debt, the capital tied up alone generates financing costs of roughly 2.75 million US dollars a month — before any lost rental income, contractual penalties or price rises during construction.
- The industry notoriously delivers late. Across all asset classes, large construction projects typically take 20 per cent longer than planned and run up to 80 per cent over budget [7]. Data centres are no exception; on the contrary, their density of services multiplies the opportunities for clashes and rework.
And after handover the bill goes on: according to the Uptime Institute, the most recent major outage cost more than 100,000 US dollars at 57 per cent of the operators surveyed, and more than a million at one in five [8]. Anyone handing over unchecked under time pressure merely shifts the schedule risk into operation.
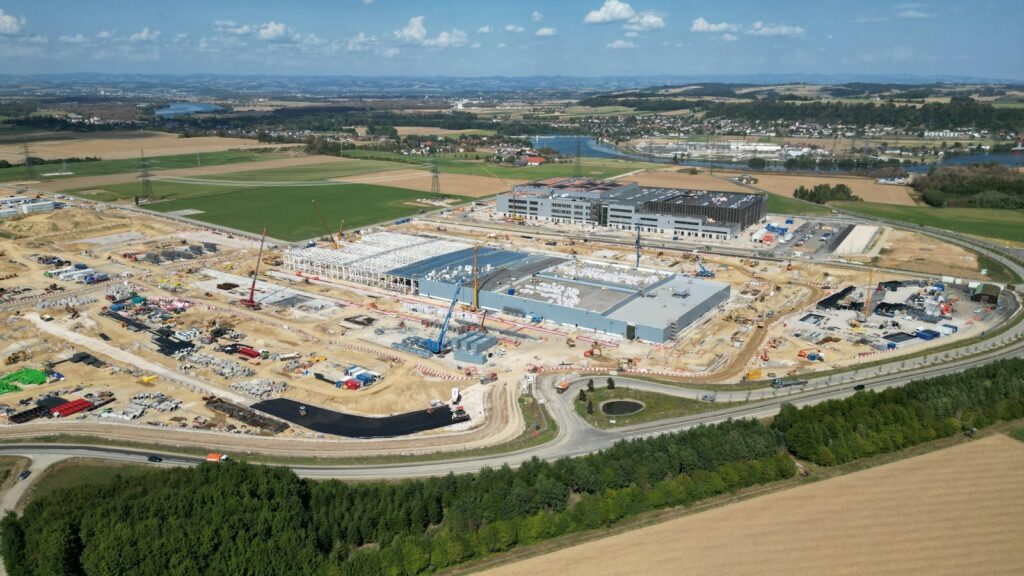
New build: the programme needs a method of measurement
Programmes rarely fail on the planning and mostly on the fact that nobody objectively knows where the project really stands. That is exactly what construction progress documentation is built for: the currently active section is captured by laser scan at agreed intervals, compared component by component against the design model and reported as a percentage of completion — per component, per trade or per construction section.
For a data centre project that means in concrete terms: deviations show up within the cycle, not at handover, and with a stated tolerance rather than as an impression. The measured state of work can serve as the basis for the assessment of work done on which interim payments depend, which at the contract values usual here replaces argument with figures for both sides. Raised floors, routes and shafts are documented before they are closed up. And at the end there is an as-built comparison together with an updated model, instead of having to reconstruct the built state after completion. At 74 per cent pre-letting, every week saved by an early-detected deviation is money directly.

Existing buildings: when the data centre moves into one
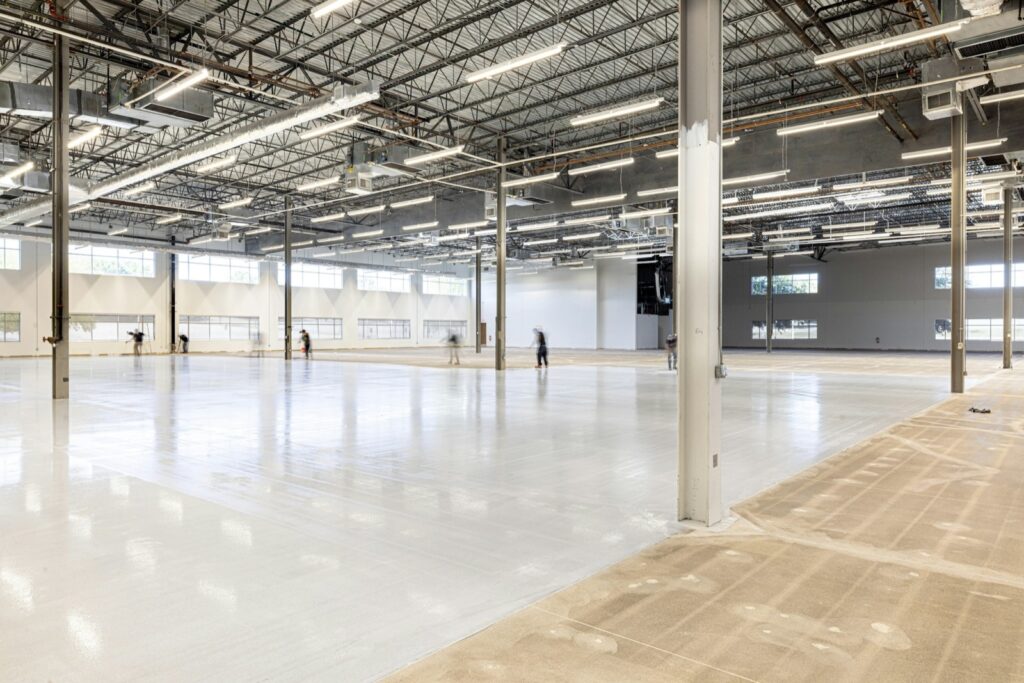
Scarce sites, grid connections and consent times make the second route attractive: data centre space in existing buildings, from the server room in an office block to the converted industrial hall. Here the existing fabric decides feasibility, and that fabric is in no old drawing.
A BIM as-built model supplies the dependable geometry: clear heights under downstand beams, column grids, transport routes for plant components, areas to DIN 277. MEP modelling adds the discipline model of the existing services, so that the new cooling, electrical and fire-fighting systems can be designed and clash-checked against the real installed network rather than against assumptions. What is visible is measured, what comes from documents is marked as such — and precisely this honesty prevents the surprises that cost weeks in a data centre fit-out.
The conclusion in one sentence
The market figures are unambiguous: sold capacity, tied-up capital, rising build costs [4][5][6]. Anyone building under those conditions cannot afford programme statements based on feel, and the difference between feel and measurement is exactly one regular, component-accurate capture.
Are you planning, building or extending a data centre?
We capture, compare against the design and deliver the state as a figure, not as an impression.
Sources
- McKinsey & Company: AI power: Expanding data center capacity to meet growing demand
- McKinsey & Company: The cost of compute: A $7 trillion race to scale data centers
- Bitkom e. V. / Borderstep Institut: Rechenzentren in Deutschland, Update 2025
- CBRE: North America Data Center Trends H1 2025
- CBRE Investment Management: Data Centers: Ain’t No Mountain High Enough
- Turner & Townsend: Data Centre Construction Cost Index 2025
- McKinsey & Company: Imagining construction’s digital future (2016)
- Uptime Institute: Annual Outage Analysis 2025